crime
crime
* based on official police data 2025
Safety Is Your Right
In France, the right to personal safety is protected by the Constitution of the Fifth Republic, the Civil Code’s obligation de sécurité, and the Code de la sécurité intérieure. For anyone moving through Paris — residents, commuters, or newcomers evaluating where to live — this right extends to the streets, transport corridors, and public spaces that shape daily routines. Paris’s administrative boundaries are broad and internally diverse, and conditions can vary significantly even within the same arrondissement or between Paris and its 122 neighbouring communes. This platform uses official crime statistics published by the Ministry of the Interior (SSMSI) to provide a structured, data‑driven view of recorded incidents across the city.
Understanding Safety Across Paris Through Data
This independent analytical project provides view of public‑space crime patterns across Paris using official SSMSI data published under the Licence Ouverte / Etalab. Crime levels in Paris vary sharply between areas, and these differences often appear even between adjacent streets. The purpose of this platform is to make those spatial contrasts visible and comparable through a consistent analytical framework — a tool for anyone assessing neighbourhood conditions when choosing where to rent, buy, or plan daily movement.
While official police datasets are transparent and valuable, they are published only at the arrondissement level. This aggregation makes it difficult to understand how crime varies within smaller neighbourhood units or how exposure changes from one part of an arrondissement to another. This project addresses those limitations by applying a uniform analytical model focused on comparability and spatial distribution.
Why Existing Police Data Views Are Not Enough
The official Paris crime map is not overlaid on a street network, making it practically impossible to determine crime levels for a specific address or neighborhood block. Users cannot pinpoint risk at a micro-geographic scale because the data is presented without spatial reference to streets, intersections, or landmarks.
The map also fails to provide a consolidated safety index, instead displaying crime levels only as separate, isolated categories — leaving users unable to assess overall neighborhood danger or compare two districts holistically.
Furthermore, incidents are normalized exclusively by resident population, a metric that severely distorts the actual risk for visitors, commuters, and anyone passing through the area. Parks and green spaces with few residents appear deceptively dangerous, while in reality, the probability of encountering crime while moving through such areas is comparatively low — a distortion that arises solely from population-based normalization rather than area-based exposure.
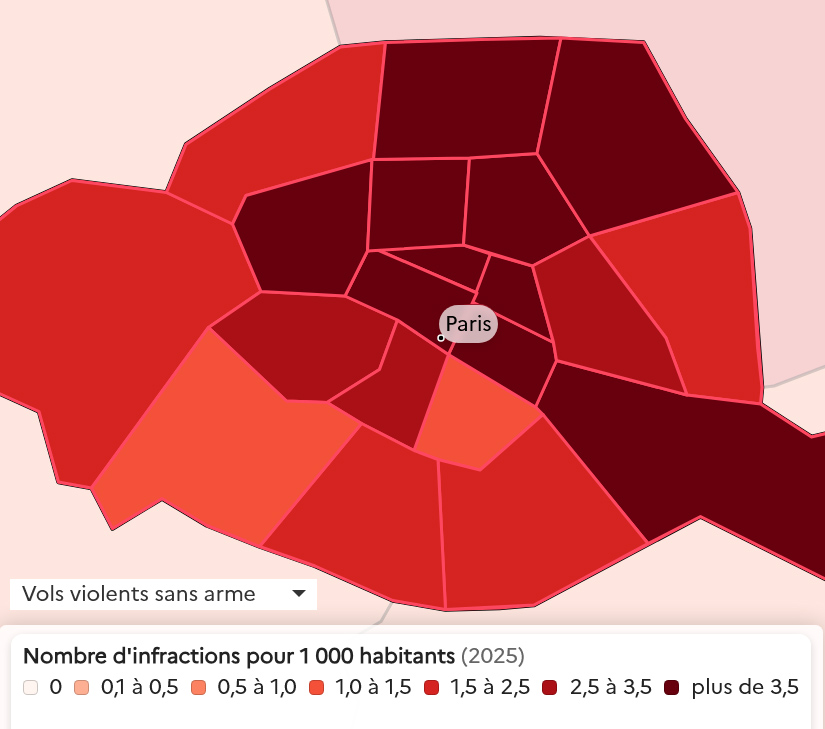
Try the official Paris Crime Map by SSMSI
Although modern open data is limited to arrondissement‑level reporting, the Préfecture de Police historically maintained — and still maintains internally — far more detailed neighbourhood‑scale records. On rare occasions, up to 2010, the Ministry of the Interior published crime information for all 121 conseils de quartier. These archival releases illustrate the level of spatial detail that exists internally, even though current public datasets are aggregated.
As a concrete example of this finer spatial resolution, a dedicated page presents the official 2005 ONDRP map of sexual‑violence incidents reconstructed at the level of all 121 conseils de quartier: Paris 2005 Sexual‑Violence Map. While the spatial granularity matches the original publication, the reconstruction applies a modern analytical step — normalising incident counts by quartier surface area — which makes the historical data comparable across zones and more suitable for interpreting relative concentration patterns.
How to Use the Map
How to Check an Address or Hotel
To evaluate a specific location, enter any Paris address or hotel name into the search field at the top of the page and click "Search". The map view will automatically center on the selected location.
Assess the relative safety level of the surrounding area based on the background color shading. You can also click directly on the zone to view detailed, official police-recorded statistics for public-space offences aggregated over the past year.
How to Use the Map Filters
Each arrondissement can be selected to view underlying SSMSI incident counts and the resulting Local Crime Level indicator. Filters allow users to isolate specific offence categories and observe how different types of crime are distributed across the city.
Hotel markers are included solely for spatial reference. The map does not label any location as safe or unsafe — it provides a comparative analytical view of recorded crime distribution to support independent interpretation when evaluating neighbourhoods for living, renting, or everyday movement.
Looking for a Hotel in a Safe Area of Paris?
Browse and compare about 1,000 hotels, hostels and apartments in Paris by area Crime Level, star rating, type and minimum price — then book through a major partner service on our Paris hotels by safety and crime level page.
Local Crime Level Across the 20 Arrondissements and 122 Suburban Communes
Paris is divided into 20 administrative arrondissements, and the map additionally includes 122 neighbouring communes for broader contextual reference. For each arrondissement and commune, recorded incidents from the SSMSI dataset are aggregated and weighted by severity to produce a Local Crime Level — a density‑based indicator reflecting the relative concentration of public‑space offences.
The model includes offences most relevant to public‑space exposure. Each offence type is assigned a severity coefficient (1–10) based on an independent analytical model reflecting relative seriousness. These coefficients are not official ratings but author‑defined parameters used to introduce a severity dimension into the analysis. Normalising incident counts by surface area allows meaningful comparison between arrondissements of different sizes and reveals spatial differences not visible in raw totals.
Transparent & Lawful
All information is sourced from official French government datasets published by the Ministry of the Interior (SSMSI) under the Licence Ouverte / Etalab. Only recorded incidents with published arrondissement‑level data are included. No private, commercial, or non‑governmental data sources are used.
The methodology — including offence selection, severity weighting, normalisation and aggregation — is documented in detail on the Legal & Methodology page. Data handling complies with the CRPA, CADA Law, and relevant guidance on the reuse of public‑sector information.
Comprehensive Disclaimer
This platform visualises historical police‑recorded data and does not provide real‑time monitoring, predictions, or guarantees of safety. Local Crime Level values are comparative indicators and must not be interpreted as absolute measures of risk. Lower values do not guarantee safety, and higher values do not imply that incidents will occur.
The map is intended as an analytical tool to support spatial awareness and comparative analysis. Users remain responsible for their own decisions regarding movement, accommodation, and long‑term residential choices. It should be used alongside other sources of information and local context.